Introduction
This weeks our task was to prepare a set of maps that will be used in a future activity in navigation. Two things are required to navigate, a set of tools that allows the user to determine their position, and some type of projection in which that position can be referenced. In our case we will be using a compass and a set of maps of our own creation. We will be using these tools to navigate a preset course around the grounds and woods of the Priory at the University of Wisconsin Eau Claire.
Methods
In addition to knowing the direction in which we are going, we will also need to know how far we are traveling from point to point. The method we will be using to determine this distance will be a pace count, knowing how many steps a person takes given a set distance. In this case our pace count was determined over a span of 100 meters. We laid out two 50 meter tape measures, end to end, on the sidewalk and then counting the number of steps taken with just the right foot over that distance. After determining our individual pace counts, we were given a geodatabase with information and various map layers and were told to construct a map that we thought would be the best to use in our future navigational activity.
The layers that we had to choose from were aerial imagery, a section of the USGS quadrangle, black and white imagery, and 2 ft contour lines imposed over the area of interest. What I decided to use were the layers of aerial imagery and contour lines.
The base of any map is the coordinate system and the projection, a developable surface tied down with a series of data points which allow a coordinate system to be tied to the earth in a flat representation of the Geoid and ellipsoid model that is the Earth. In this case it is Nad83_WTM, and the projection is Universal transverse Mercator (UTM). UTM is designed so that that the world is divided east to west into 60 zones, with each zone being 6 degrees of longitude and distortion is minimized in each zone.
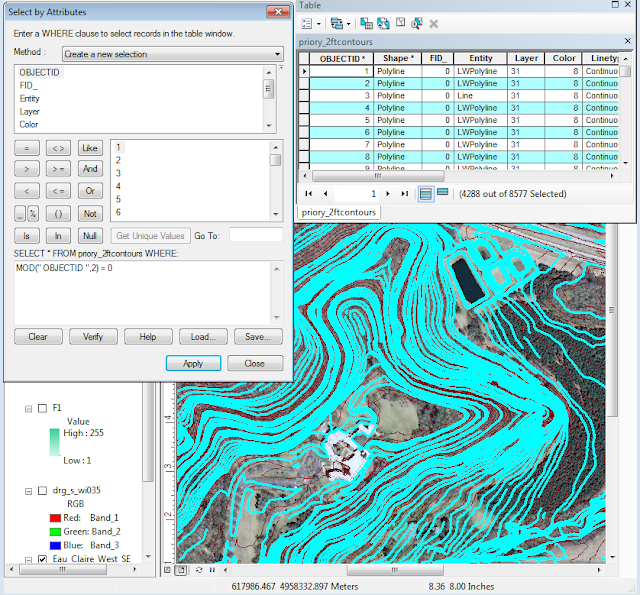
Eventually I found a command with the "select attribute" feature in the contour line table, on ESRI's website which allowed me to select every other contour line based on the object ID field with the script, MOD("OBJECTID",2) = 0 (Fig 2). This script allowed me to select object ids in intervals of two, but i also attempted to select various intervals and see what the map looked like then. I then removed the contour lines and began building my first map.
 |
| Fig 2. Every other contour line selected. |
Results/Discussion
The finished maps, (Fig 3,4) with grids imposed over the top of the maps for a reference point via navigation. Fig 3 shows the Contour lines navigational map with a measure grid. Each grid square represents both 50 meters in the X and Y direction. Pace count, directional arrow, scale, real world scale, and sources included on the right hand informational column.
 |
| Fig 3. Finished Navigational map with all map elements and grid.
Fig 4 shows the Contour lines navigational map with a graticule grid. Each grid square represents 0 degrees, 0 Minutes and 1 second in decimal degrees for the X and Y direction. Pace count, directional arrow, scale, real world scale, and sources included on the right hand informational column.
|
 |
| Fig 4 Finished Aerial photograph reference map with grid.
Conclusion
While the second both maps seem to be a little spars in information, I believe that it will serve to be of greater benefit to have less information in the field when using either of these maps, as the maps wont distract the user with unnecessary information. The only thing that I would change after doing the project would be to make the grid lines to be more of a contrasting color such that they would be easier to detect. When the maps are in the size they were meant to be (11"x17") the do show up better than what is represented here.
|


No comments:
Post a Comment