Introduction:
Our assignment for this week was to conduct a survey based on distance and Azimuth measurements. While we can do more advanced survey methods, a distance azimuth survey is a very versatile survey method that can work in a verity of conditions and can be adapted when other methods wont work or technology fails.
The basic idea behind an azimuth survey is that the person who is surveying stands in one spot, and takes the azimuth measurement (degrees) of an object around them, and they also record the distance to that object.
This method develops a standard point at which all other points are measured relative to that position, with distance from that survey position to the object. The map therefore is retaliative representation of the area surveyed based on the point the surveyor chooses. This fact is what makes the azimuth survey so versatile, the position of the survey can be any wear, and can be referenced later if other technology is not working or forgotten. All that is needed is to pick a position that has a stationary reference, such as a landmark, or in this case a light post. All measurements can be determined and the survey repeated as long as that light post is known and described in ones field notes.
Study Area:
The area in which we conducted our azimuth survey was outside of Phillips Hall on the UWEC campus, specifically on the sidewalk just to the northwest corner of the building where the sidewalk connects to the main side walk through the campus mall, near the first bridge over Little Niagara Creek. We choose to use the light post as are stationary reference point.
 |
| Fig 1. The Eau Claire Campus Mall Study Area. The area circled in red is the specific study area, with the stationary reference point at the green circle on the picture above. |
The survey area is bisected by Little Niagara Creek, with multiple trees scattered across the banks. New trees have been planted closer to the sidewalk and range in size of 6 to 10 feet, while larger trees (as seen in Fig 1) are planted closer to Phillips hall.
Methods:
With the stationary point selected we used began by having a person stand on the designated spot near the light post and had others select a tree to begin the azimuth survey, the people who selected tree measured the trees diameter at breast height (DBH in CM), and the species of the tree. The person standing on the designated spot would then take a distance measurement from that spot to the tree using the Sonic Combo Pro, which had the receiver unit placed on a tree with the sending unit sending a sound wave while placed at the users chest, a distance measurement was then taken. A second person would then use the True-pulse 360 B unit to get an azimuth measurement in both an X and Y direction of the tree by looking thorough the unit and sending out a laser, which also took a distance measurement. It is important to note that because we took the azimuth measurements from the same spot, the X and Y valuse was always the same (Fig 2). This process was repeated until all of the trees in the area were captured.
When we got back to the lab. the information that we recorded had to be uploaded to ArcMap. In order to do that we had to enter the data into an excel sheet in
 |
| Fig 2. Normalized table of measurements, Note that the Y and X measurement is constant because we were always in the same position. Azimuth was measured in degrees and distance in meters, DBH was measured in Centimeters. |
In excel the data could be entered two ways using the "add XY data" function in ArcMap, or by using the "bearing distance to line" command. Once the data points were in ArcMap we used the "Feature Vertices to Points" command, and were able to add lines connecting the stationary survey point to each point.
 |
| Fig 3. Azimuth Tree Survey. The legend shows the trees presented by species.Also note the placement of the trees, (ie. No trees were surveyed inside the building), see the conclusion below. |
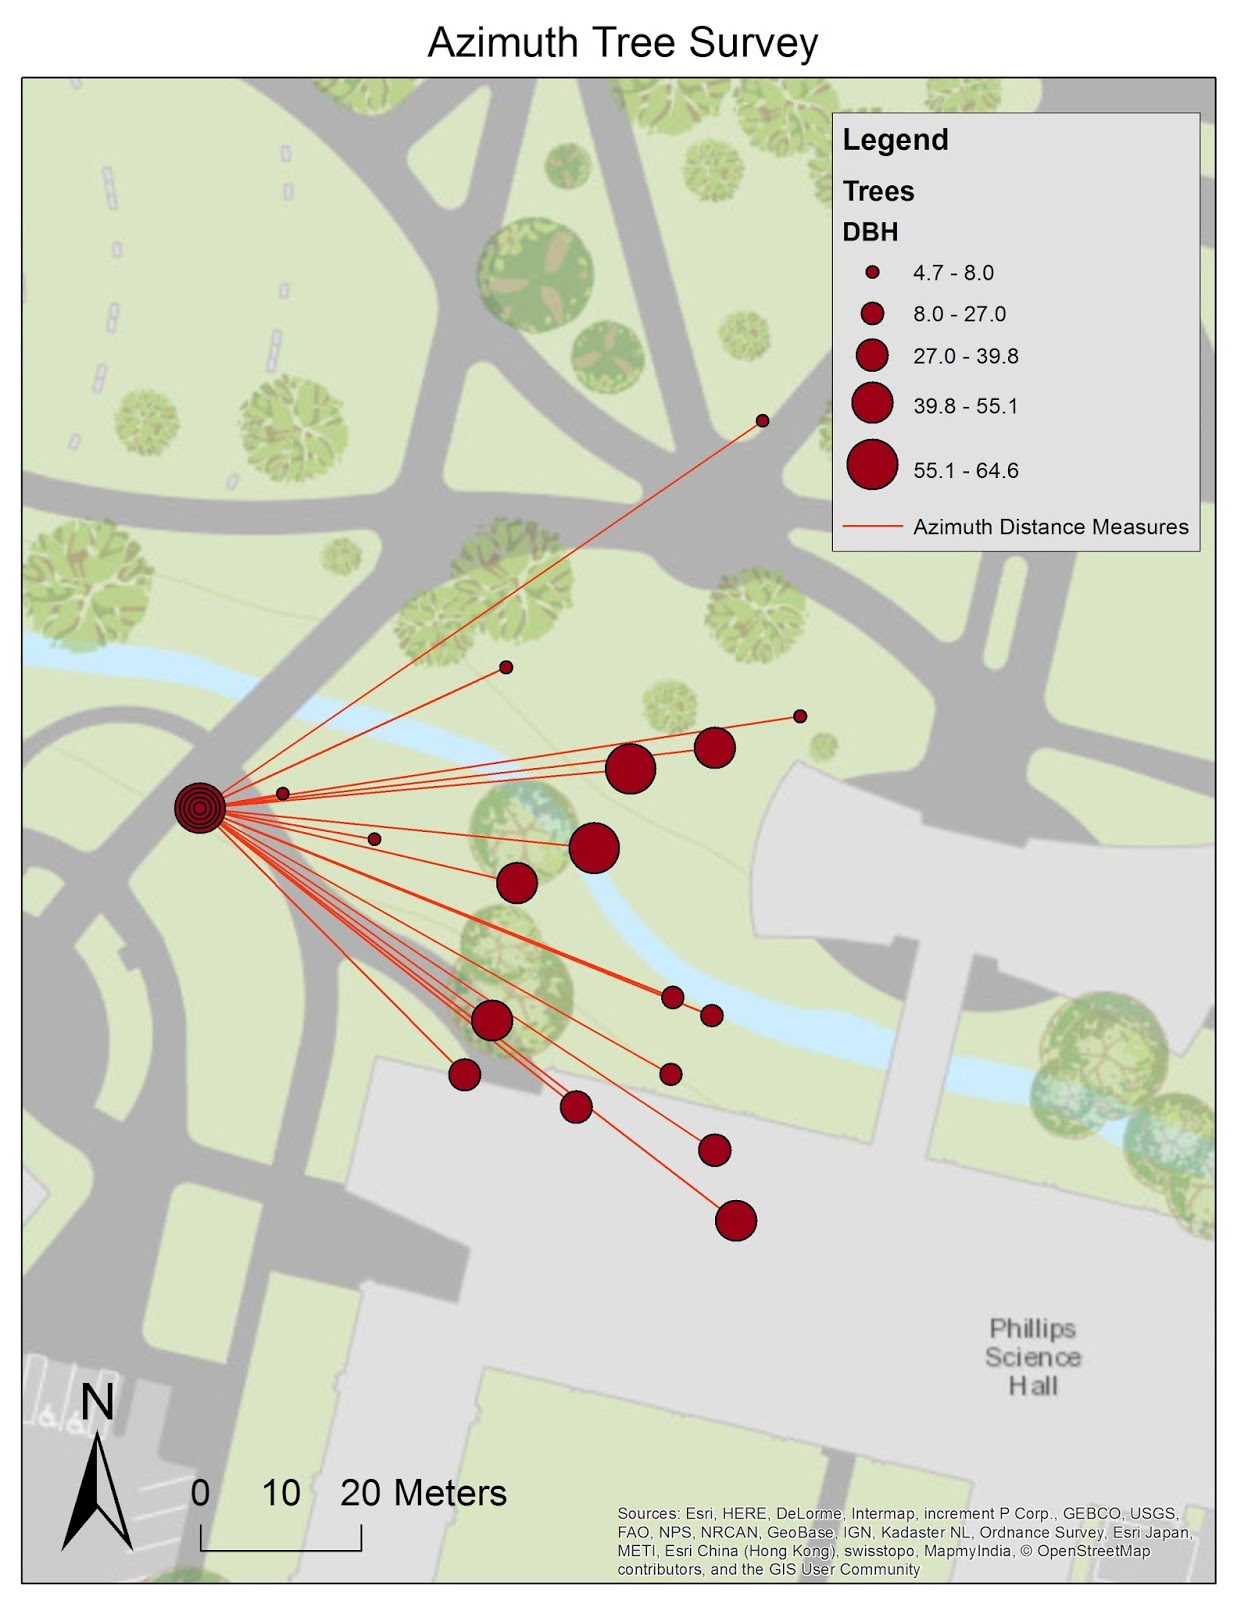 |
| Fig 4. Azimuth Tree Survey, here trees are represented by Diameter at Breast Height (DBH). Also note the placement of the trees, (ie. No trees were surveyed inside the building), see the conclusion below. |
One problem That I ran into was that when the data for the XY coordinates was uploaded to a shapefile, the location of the data was coming up as off the coast of Africa instead of Phillips hall. It turns out that as I was uploading the data with the "bearing distance to line" tool, I had input the X data as the Y data as well as putting the X data as the Y data. This resulted in my Latitude and Longitude being switched, and my entire survey being in the wrong place.
Another problem I have ran into is that he bearing distance to line tool didn't designate the stationary point as being different from all of the rest of the points, this has resulted in mapping issues, such as in Fig. 4, all the points are represented, stacked on top of each other, as the starting point.
The Azimuth survey has a lot of positives, its easy to deploy in the field, quick to do, easily replicated, and requires a low level of technology to complete. The survey technique is also easy to upload and use in GIS.
As you can see, the results of the mapping though are not that accurate, in both Figures 3 and 4 the survey has recorded that there are trees in Phillips Hall. It has also recorded tree points in the middle of the courtyard, where we did not survey.
So while the azimuth survey does a quick and efficient job, that is precise based on the point of origin of the survey, it is not the most accurate, so it must be used with caution.
No comments:
Post a Comment